
On this page:
- Percentage of Children Ages 3–17 with a Communication or Swallowing Disorder During the Past 12 Months: United States, 2012
- Percent Distribution of Types of Communication or Swallowing Disorders among Children Ages 3–17 with a Voice, Speech, Language, or Swallowing Disorder During the Past 12 Months, by Age Group: United States, 2012
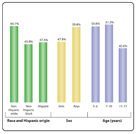
- Percentage of Children Ages 3–17 with Any Communication or Swallowing Disorder During the Past 12 Months, by Race and Hispanic Origin, Sex, and Age Group: United States, 2012
- Percentage of Children Ages 3–17 with a Communication or Swallowing Disorder Who Received an Intervention Service During the Past 12 Months, by Type of Disorder: United States, 2012
- Percentage of Children Ages 3–17 with Any Communication or Swallowing Disorder Who Received an Intervention Service During the Past 12 months, by Race and Hispanic Origin, Sex, and Age Group: United States, 2012
- Lifetime Prevalence of Voice Problems or Disorders for Teachers and Non-Teachers
- Relative Risk of Ever Having Voice Problems or Disorders for Adults with Selected Conditions
- Relative Risk of Ever Having Voice Problems or Disorders for Adults with Current Medication Use
- Prevalence of Stuttering in African American and European American Children in Illinois
- Prevalence of Speech Problems in U.S. Children by Sex
- Mean Language Scores and Non-Verbal I.Q. Scores for 6-Year-Olds
- Prevalence of a Reading Disability in Second- and Fourth-Graders
- Relative Risk of Children Having Specific Language Impairment, by Parent's Level of Education
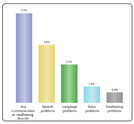
Percentage of Children Ages 3–17 with a Communication or Swallowing Disorder During the Past 12 Months: United States, 2012
Chart showing any voice, speech, language, or swallowing disorder among children ages 3–17.
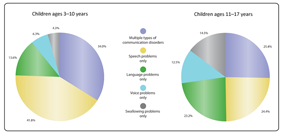
Percent Distribution of Types of Communication or Swallowing Disorders among Children Ages 3–17 with a Voice, Speech, Language, or Swallowing Disorder During the Past 12 Months, by Age Group: United States, 2012
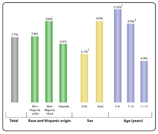
Percentage of Children Ages 3–17 with Any Communication or Swallowing Disorder During the Past 12 Months, by Race and Hispanic Origin, Sex, and Age Group: United States, 2012
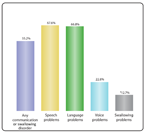
Percentage of Children Ages 3–17 with a Communication or Swallowing Disorder Who Received an Intervention Service During the Past 12 Months, by Type of Disorder: United States, 2012
Percentage of Children Ages 3–17 with Any Communication or Swallowing Disorder Who Received an Intervention Service During the Past 12 months, by Race and Hispanic Origin, Sex, and Age Group: United States, 2012
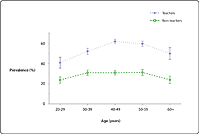
Lifetime Prevalence of Voice Problems or Disorders for Teachers and Non-Teachers
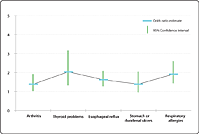
Relative Risk of Ever Having Voice Problems or Disorders for Adults with Selected Conditions
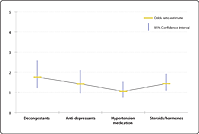
Relative Risk of Ever Having Voice Problems or Disorders for Adults with Current Medication Use
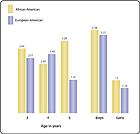
Prevalence of Stuttering in African American and European American Children in Illinois
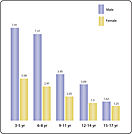
Prevalence of Speech Problems in U.S. Children by Sex
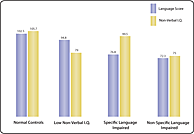
Mean Language Scores and Non-Verbal I.Q. Scores for 6-Year-Olds
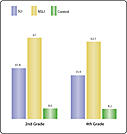
Prevalence of a Reading Disability in Second- and Fourth-Graders
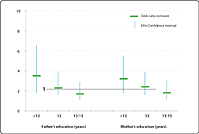
Relative Risk of Children Having Specific Language Impairment, by Parent's Level of Education
Last Updated Date: