
Chart created by the NIDCD Epidemiology and Statistics Program.
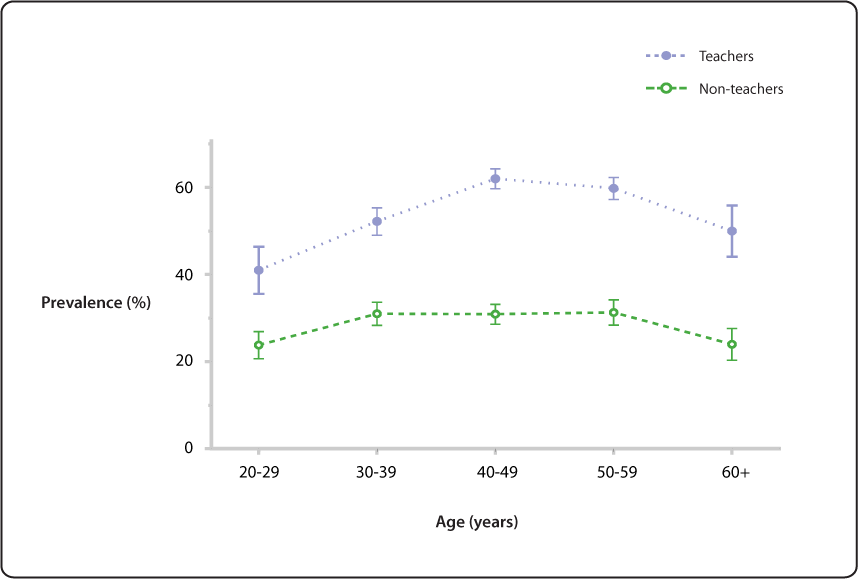
In this figure, the lifetime prevalence of voice problems or disorders is plotted by occupation (teacher or non-teacher) and decade of life for working age adults (20 to 66 years). A voice problem or disorder was defined as "any time the voice does not work, perform, or sound as it normally should, so that it interferes with communication." These data are based on self report as provided in a telephone survey conducted by Roy and colleagues. The error bars are standard errors for each of the estimates shown in the figure. These standard errors were computed by the NIDCD Epidemiology and Statistics Program based on information provided in the reference. An approximate 95% confidence interval can be estimated by doubling the standard error bars. Based on this knowledge, it is clear that teachers have a significantly increased risk of lifetime voice problems or disorders compared to non-teachers across each decade of their working lives.
Reference
- Roy N, Merrill RM, Thibeault S, Parsa RA, Gray SD, Smith EM. Prevalence of voice disorders in teachers and the general population. (abstract) J Speech Lang Hear Res. 2004 Apr; 47(2): 281–293.