On this page:
Newborn and Infant Hearing Screening
- Newborns Receiving Hearing Screening Before Age 1 Month (Percent) (Updated in 2018)
- Infants With Possible Hearing Loss Receiving Hearing Evaluation Before Age 3 Months (Percent) (Updated in 2018)
- Infants With Hearing Loss Receiving Intervention Services Before Age 6 Months (Percent) (Updated in 2018)
Ear Infections
- Ambulatory Care Visits to U.S. Physicians Resulting in a Diagnosis of Otitis Media (Updated in 2012)
Hearing Aids and Cochlear Implants
- New Cochlear Implants in 2001
- Use of Hearing Aids in 2006 (Updated in 2012)
- Use of Hearing Aids by Adults With Hearing Loss (Per 1,000 Population, 70+ Years) (Updated in 2018)
Hearing Loss
- Hearing Loss Increases With Age (Posted in 2017)
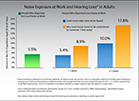
- Noise Exposure at Work and Hearing Loss in Adults (Posted in 2017)
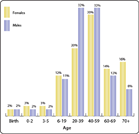
- Age at Which Hearing Loss Begins (Posted in 2012)
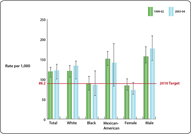
- Noise-Induced Hearing Loss Among Adults (Posted in 2012)
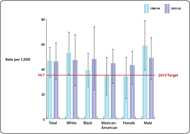
- Noise-Induced Hearing Loss Among Adolescents (Posted in 2012)
Tinnitus
Newborn and Infant Hearing Screening
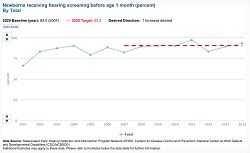
Newborns Receiving Hearing Screening Before Age 1 Month (Percent)
Reports on the Healthy People 2020 objective to increase the proportion of newborns who are screened for hearing loss before 1 month of age.
View Healthy People 2020 Chart on Newborns Receiving Hearing Screening Before Age 1 Month (Percent)
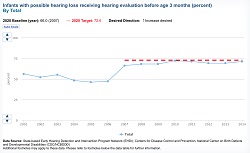
Infants With Possible Hearing Loss Receiving Hearing Evaluation Before Age 3 Months (Percent)
Reports on the Healthy People 2020 objective to increase the proportion of newborns who receive audiologic evaluation before 3 months of age for infants who did not pass the hearing screening.
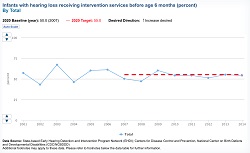
Infants With Hearing Loss Receiving Intervention Services Before Age 6 Months (Percent)
Reports on the Healthy People 2020 objective to increase the proportion of infants with confirmed hearing loss who receive intervention services before 6 months of age.
Ear Infections
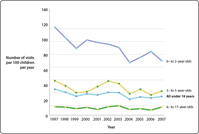
Ambulatory Care Visits to U.S. Physicians Resulting in a Diagnosis of Otitis Media (Ear Infection)
Yearly number of ambulatory care visits (per 100 children) that result in a diagnosis of otitis media, by age of the child patient.
Hearing Aids and Cochlear Implants
New Cochlear Implants in 2001
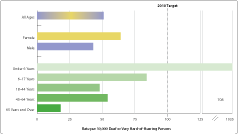
Number of new cochlear implants per 10,000 deaf or hard-of-hearing persons in 2001, by sex and age.
View Chart on New Cochlear Implants in 2001
Use of Hearing Aids in 2006
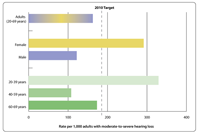
Number of hearing aids per 1,000 adults in 2006, by sex and age.
View Chart on Use of Hearing Aids in 2006
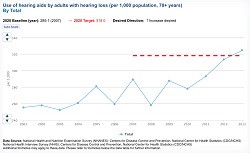
Use of Hearing Aids by Adults With Hearing Loss (Per 1,000 Population, 70+ Years)
Reports on the Healthy People 2020 objective to increase the proportion of adults aged 70 years and older with hearing loss who have ever used a hearing aid.
Hearing Loss
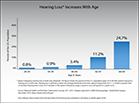
Hearing Loss Increases With Age
Percent of the U.S. population aged 20-69 with hearing loss > 25 decibels, by decade.
View Chart on Hearing Loss Increases With Age
Noise Exposure at Work and Hearing Loss in Adults
Percent of the U.S. population aged 20-69 with hearing loss > 25 decibels, by occupational noise exposure.
View Chart on Noise Exposure at Work and Hearing Loss in Adults
Age at Which Hearing Loss Begins
Clustered bar chart showing the age at which people first began to have hearing loss. Displays the percentage distribution by sex and age, based on subjects' report of any permanent hearing loss.
View Chart on Age at Which Hearing Loss Begins
Noise-Induced Hearing Loss Among Adults
This chart depicts the prevalence of (likely) noise-induced hearing loss from 2 time periods in adults (20–69 years) by race/ethnicity and sex (gender).
View Chart on Noise-Induced Hearing Loss Among Adults
Noise-Induced Hearing Loss Among Adolescents
This chart shows the prevalence of (likely) noise-induced hearing loss from 2 time periods in adolescents (12–19 years).
View Chart on Noise-Induced Hearing Loss Among Adolescents
Tinnitus
Prevalence of Chronic Tinnitus
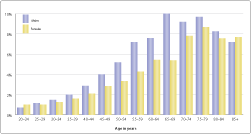
Percentage of males and females with tinnitus lasting at least three months, by age.


