
Chart created by the NIDCD Epidemiology and Statistics Program.
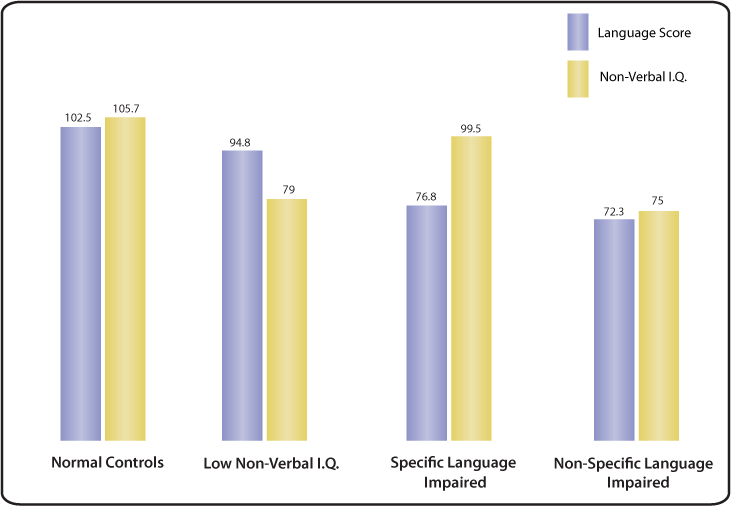
This figure displays language scores and intelligence quotients (I.Q. scores) for four groups of children: normal controls, children with low non-verbal I.Q., children identified with specific language impairment, and children with non-specific language impairment. Both I.Q. and language scores have expected mean scores of 100 for normal control children and one standard deviation ranges from 85 to 115. Children with non-specific language impairment scored about two standard deviations below the mean (~ 70) on language as well as non-verbal I.Q. Children with specific language impairment had non-verbal I.Q. scores that were normal (mean = 100), but were almost 2 standard deviations below the mean for the language score. Children with low non-verbal I.Q. scores had nearly normal language scores.
Reference
- Catts HW, Fey ME, Tomblin JB, Zhang X. A longitudinal investigation of reading outcomes in children with language impairments. (abstract) J Speech Lang Hear Res. 2002 Dec; 45(6): 1142–1157.