
Chart created by the NIDCD Epidemiology and Statistics Program.
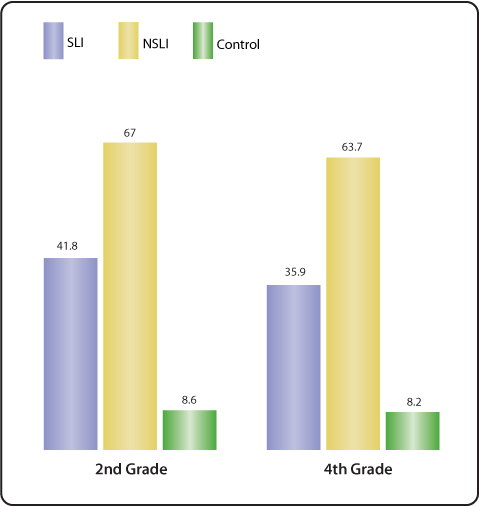
The groups of children shown in the previous figure were a subsample of children who participated in an epidemiologic study of language impairment in kindergarten.[1] These children were followed into second and fourth grades when reading disability was also assessed.[2] Children who had been identified in kindergarten with specific language impairment (SLI) were much more likely to have reading disability in second grade (about 40%) and fourth grade (about 36%) compared to normal control children (about 9% in both 2nd and 4th grade). However, children with non-specific language impairment (NSLI), who also had low non-verbal I.Q. scores, were even more likely to have reading disability (about 67% in 2nd grade and 64% in 4th grade). The other group of children with normal language scores but low non-verbal I.Q. scores (shown in the previous figure) is not shown here. Catts, et al., state in their abstract that children with language impairment in kindergarten who had improved in spoken language abilities by second and fourth grades had better reading outcomes than those with persistent language impairments.[2]
References
- Tomblin JB, Records N, Buckwalter P, Zhang X, Smith E, O'Brien M. Prevalence of specific language impairment in kindergarten children. (abstract) J Speech Lang Hear Res. 1997 Dec; 40(6): 1245–1260.
- Catts HW, Fey ME, Tomblin JB, Zhang X. A longitudinal investigation of reading outcomes in children with language impairments. (abstract) J Speech Lang Hear Res. 2002 Dec; 45(6): 1142–1157.