
Chart created by the NIDCD Epidemiology and Statistics Program.
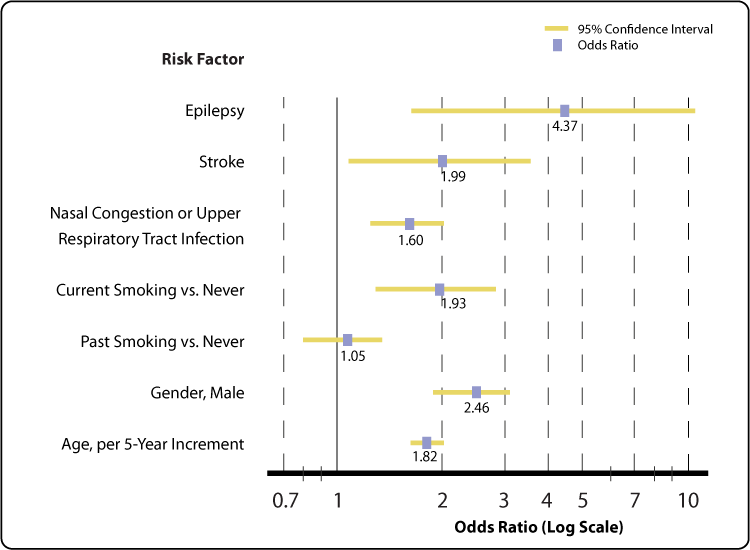
This figure shows the strength of several risk factors for olfactory impairment in a population-based study of sensory loss and aging in older adults in Beaver Dam, WI.1
An odds ratio of 2 corresponds to a doubling of the risk of olfactory impairment, as is shown for subjects having had a stroke (versus “no stroke”) or for current smokers (versus “never smoked”). The increased risk for males was 2.5 times that of females in this Beaver Dam, WI, cohort of older subjects. Adjusted odds ratio estimates (vertical bars) and 95% confidence intervals (bars extended to both sides) are shown for each risk factor, as estimated in a multiple logistic regression model after elimination of factors that did not contribute to the statistical fit.
The scale for the odds ratio or X-axis is logarithmic and, on this scale, confidence intervals are symmetric about the odds ratios. The highest odds ratio of 4.4 is for subjects with epilepsy (versus no epilepsy); however, the confidence interval is wide, ranging from 1.7 to 11.2. The wide confidence intervals probably indicate the number of subjects with epilepsy was relatively few in this study of 2,491 subjects aged 53 to 97 years.
Nasal congestion and upper respiratory tract infection had a smaller but significant odds ratio of 1.6, but the confidence interval was narrow, 1.3 to 2.0, which reflects the fact that this condition is quite common. Such factors may contribute significantly to the attributable risk or burden of olfactory impairment, although the relative risk (odds ratio) is not large.
The odds ratio for age, categorized by 5-year age groups, was 1.8 with a very tight confidence interval of 1.7 to 1.9. This implies a strong and consistently increasing effect of aging on risk of olfactory impairment.
Of the potential risk factors included in the figure, only the effect of past smoking (versus “never smoking”) was non-significant, which is evident since the 95% confidence interval crossed (overlapped) 1.0. Potential interactions were tested for the factors shown in the figure, but none were statistically significant.
Reference
- Murphy C, Schubert CR, Cruickshanks KJ, Klein BEK, Klein R, Nondahl DM. Prevalence of olfactory impairment in older adults. (abstract) JAMA. 2002 Nov 13;288(18):2307–12.