
Note: Lower numbers are better
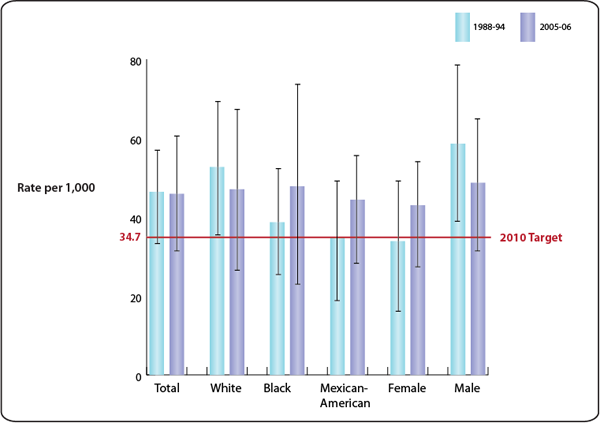
This chart shows the prevalence of likely noise-induced hearing loss from 2 time periods in adolescents (12–19 years). Note: I = 95% confidence interval. Data are for adolescents who have an audiometric notch in both ears signifying probable noise-induced hearing loss. Respondents were asked to select only one race prior to 1999. For 1999 and later years, respondents were asked to select one or more races. For all years, the categories black and white include persons who reported only one racial group and exclude persons of Hispanic origin. Persons of Mexican-American origin may be any race.
The 2010 target line represents the goal recommended by the Hearing Health group, which was discussed and approved by the Federal Interagency Working Group for Healthy People 2010.
Source: National Health and Nutrition Examination Survey, NCHS, CDC. Chart created by the Health Promotion Statistics Branch, NCHS, CDC and the Epidemiology and Statistics Program, NIDCD, NIH. Posted in November 2012.